

December 18, 2009
The big story this month is the beta release of our new scatterplots module. In addition, you can now specify more detailed run criteria on the Explore Data/Search page, and you can view and delete your mapping templates (for more about mapping templates see the October 2 release below).
 Clicking on this link opens a new Plotting & Statistics window. You can open as many of these windows as you like with different results in each one, and each window can be expanded full screen.
Scatterplots
We are happy to announce the beta release of this much requested feature. Before we delve into details, note that we've implemented this feature without requiring the installation of additional plugins and in a way that works for all supported browsers (and even some unsupported ones). We want to stress that this is a beta release, meaning that while everything pretty much works, there are a few kinks to be worked out. The biggest issue you will notice is that loading the data is slow for large data sets. For this reason, we currently limit the results displayed to the first 2,000 unique structures in your search results. We are actively working on improving the performance, and once improved we'll increase this limit to 15,000+. The good news is these improvements, once available, will also increase the speed of retrieving and exporting search results in general.Generating a scatterplot
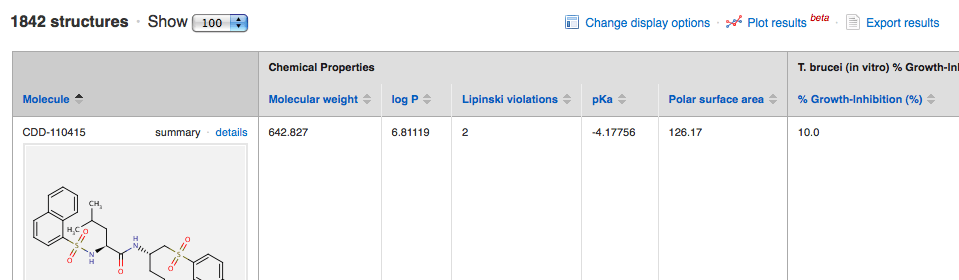
To access this feature, first run a search from the Export Data/Search page. We will demonstrate using search results from the Sandler-UCSF Celera Cysteine Protease Inhibitor Library public data set published by the McKerrow Group. After the search completes, you will see a new link above the search results: Clicking on this link opens a new Plotting & Statistics window. You can open as many of these windows as you like with different results in each one, and each window can be expanded full screen.
Scatterplot menu options
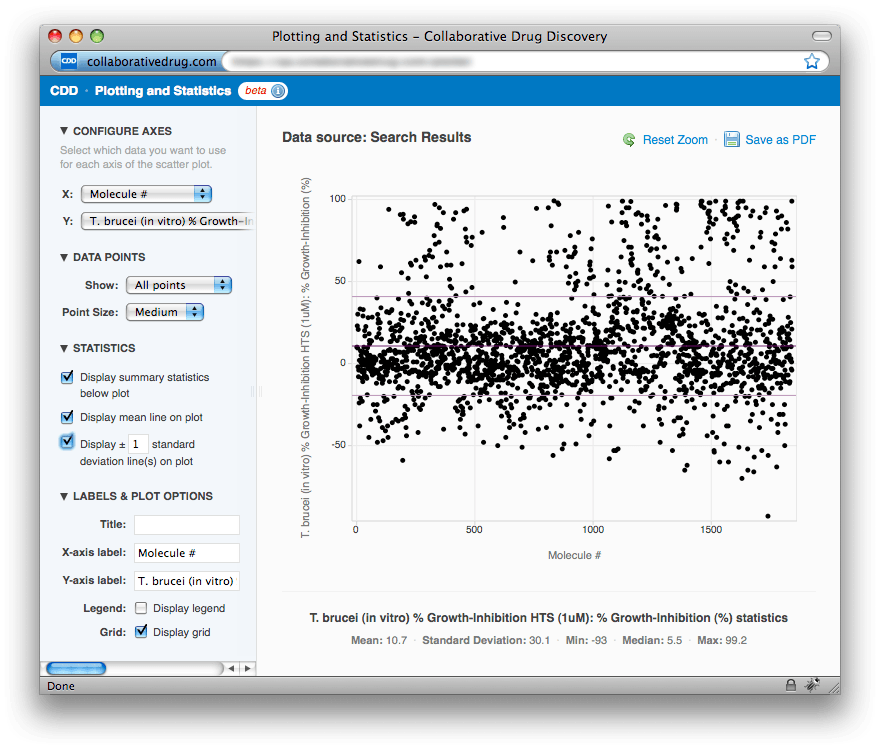
In the image above we have expanded all of the menus in the left-hand panel so that all options are visible. Beginning at the top, in the CONFIGURE AXES menu, you can select which columns from your search results you want to use for the X- and Y-axes. The options for the X-axis are: Molecule # (the order in which the molecule appears in your search results—this is something you can modify by sorting your search results) and all displayed numerical chemical properties (add or remove these using the "Customize your report" link). The options for the Y-axis are: all numerical chemical properties plus all displayed numerical readouts. In the DATA POINTS menu you can choose to display all points, just samples, or just controls, and you can set the point size (Small, Medium or Large). In the STATISTICS menu you can choose to hide the summary statistics for the Y-axis that are displayed below the plot, and you can toggle the display of mean and standard deviation lines on the plot. Finally, in the LABELS & PLOT OPTIONS menu, you can modify the X- and Y-axis labels, add a plot title, and toggle the display of the plot legend and grid.Saving plots and drilling down into the data
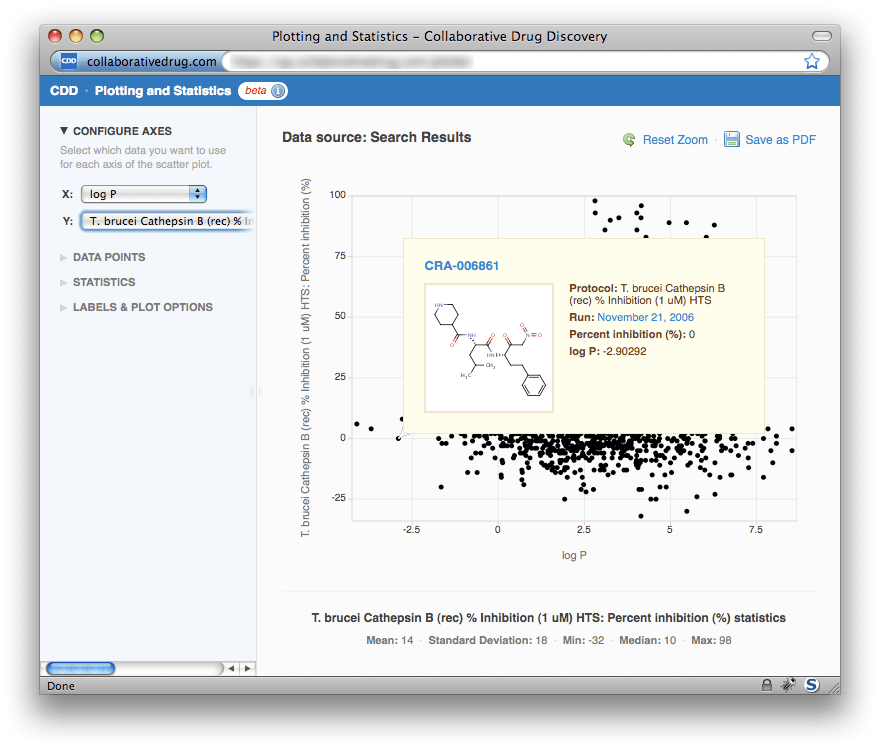
In the upper right-hand corner, there is a link to save the current plot as a PDF, which you can then drag and drop into PowerPoint or Microsoft Word for presentations and reports. As indicated by the "Reset Zoom" link, it's possible to zoom in on any region of the plot by selecting that region with your mouse. To return to the original view, just click "Reset Zoom". To view details about any particular point, just hover your mouse above the point. A small window will appear displaying the molecule's name and structure, the protocol, run and readout value, and the X-axis value. Note that the molecule name and run date are links that will take you to the corresponding molecule and run page, respectively. In this way it is easy to drill down to a molecule or readout value of interest.
Plans for the future
As mentioned above, we are actively working on improving the speed of data loading, and with that the number of data points that can be displayed at once. We also plan to allow plotting readouts from one protocol/run against another (we just have to work out what to display when a given batch of a molecule has multiple readout values in a protocol). Down the road, we plan to add more plot types (histograms and box plots). Most of all, however, we want to hear your feedback and suggestions for what would be most valuable.Search by specific run
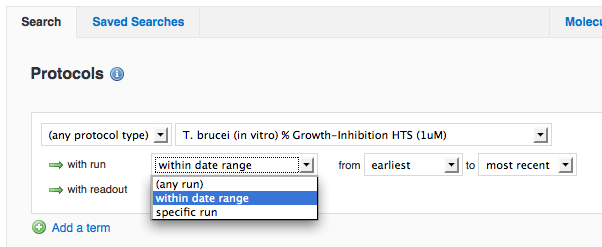
Prior to this release, the only way to restrict which runs were displayed in mine results was to pick a run date range for the entire search, even if there were multiple protocol criteria. We have moved this to be an option for each protocol criterion, and we've additionally added the ability to select a particular run (in case your Vault has more than one run on the same date). This also allows you to generate a scatterplot just for a particular run of a protocol.