

June 30, 2010
With this release, you can now automatically calculate average values for all data you import into CDD. This is helpful if you perform replicate measurements but typically only want to search and view the average of these replicates. We have also significantly expanded outliers functionality to allow you to flag any readout as an outlier, excluding it from any calculations we perform on your data (e.g. averaging, statistical summaries, etc.). We have also included some work toward a future release that will streamline the process of data quality control and analysis. In this release, this means the run page has become more interesting for those of you screening your data in plates. Finally, we've added an often requested small feature, the ability to copy a protocol, allowing you to set up many similar protocols quickly.
 You can also see that this vault averages values by batch and run. Suppose a molecule, “caffeine”, has two batches, “starbucks” and “peets”, and that this protocol has two runs on dates March 1, 2010 and June 1, 2010. If “starbucks” had rfu values of 10000 and 20000 in the March 1 run, and “peets” had an rfu value of 6000 on March 1 and 8000 and 10000 on June 1, then the system will calculate three average values: 15000 rfu for “starbucks” on March 1, 6000 rfu for “peets” on March 1, and 9000 rfu for “peets” on June 1. It is also possible to average by molecule and protocol, in which case the system would calculate only one average value in this example, 10800 rfu for the entire protocol and the “caffeine” molecule. Currently this setting, averaging by “batch and run” (the default) or by “molecule and protocol”), is vault-level, which means it applies to all protocols in a given vault. If you'd like to change this setting, please
contact support. Once you've configured an average readout definition, you will see it listed right next to the corresponding non-averaged definition on the protocol page (below), in search results, and on the run page's data tab (next section). Note that you cannot yet configure average values for dose-response calculations.
You can also see that this vault averages values by batch and run. Suppose a molecule, “caffeine”, has two batches, “starbucks” and “peets”, and that this protocol has two runs on dates March 1, 2010 and June 1, 2010. If “starbucks” had rfu values of 10000 and 20000 in the March 1 run, and “peets” had an rfu value of 6000 on March 1 and 8000 and 10000 on June 1, then the system will calculate three average values: 15000 rfu for “starbucks” on March 1, 6000 rfu for “peets” on March 1, and 9000 rfu for “peets” on June 1. It is also possible to average by molecule and protocol, in which case the system would calculate only one average value in this example, 10800 rfu for the entire protocol and the “caffeine” molecule. Currently this setting, averaging by “batch and run” (the default) or by “molecule and protocol”), is vault-level, which means it applies to all protocols in a given vault. If you'd like to change this setting, please
contact support. Once you've configured an average readout definition, you will see it listed right next to the corresponding non-averaged definition on the protocol page (below), in search results, and on the run page's data tab (next section). Note that you cannot yet configure average values for dose-response calculations.
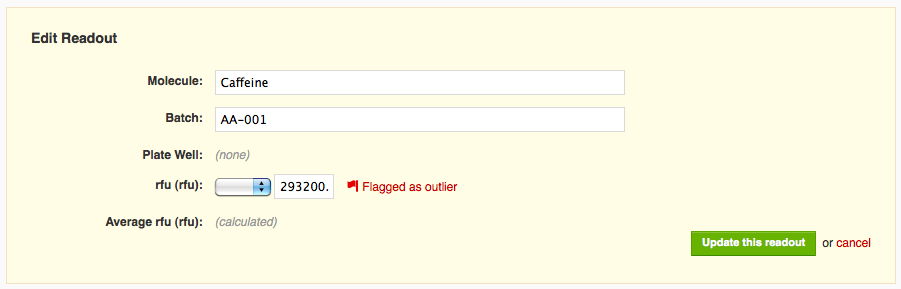
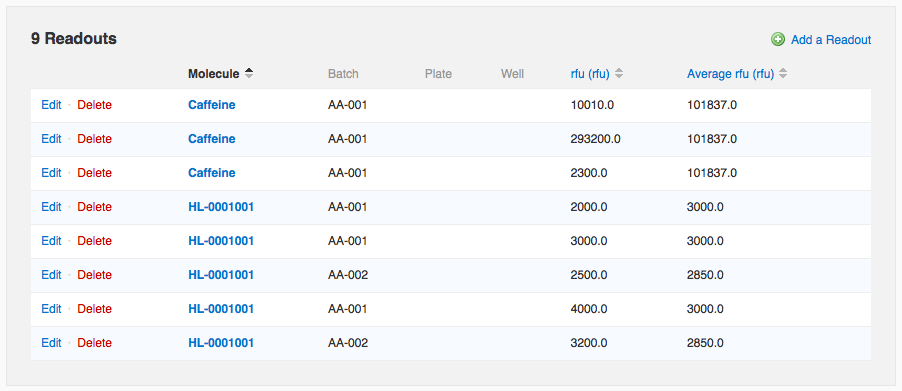 In the data below, one of the “Caffeine” measurements is wildly different from the other two. If I wish to flag that value as an outlier to exclude it from the average calculation, I can do so by editing that readout row.
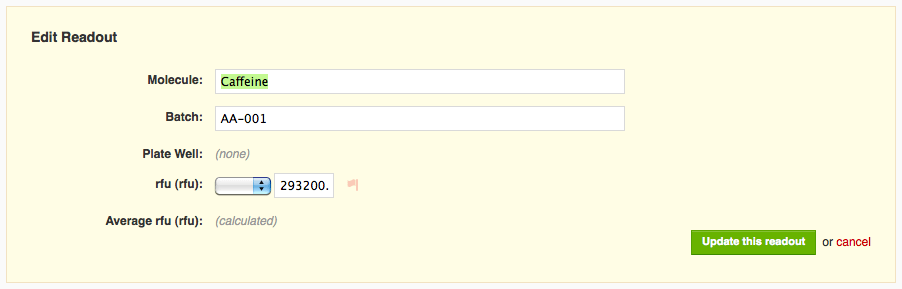 If I click on the muted flag icon next to the readout value, the flag becomes bright red, and I see text indicating that I've flagged that readout as an outlier.
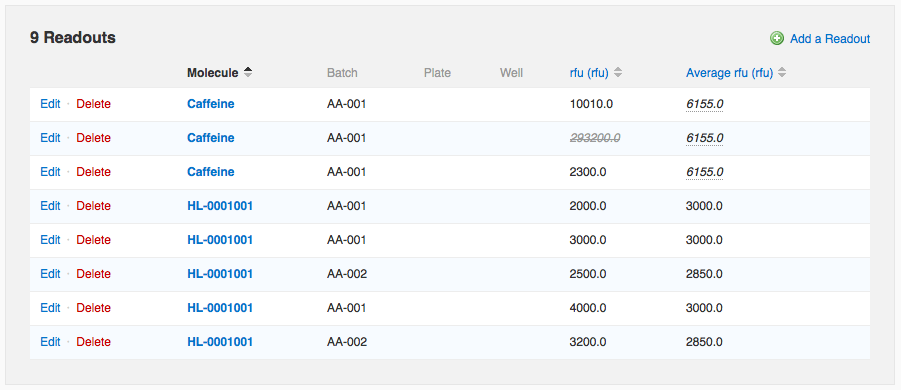
 When I save my changes, I can see that the value I flagged is now rendered in light grey, italicized, and struck through (e.g. it looks like this:
293200.0), indicating that it has been flagged for exclusion. The corresponding average value (both on that row and all other constituent rows), in addition to being recalculated to reflect only the two remaining values, also gets special formatting, italics and a dotted underline, to remind you it is not based on all recorded values.
When I save my changes, I can see that the value I flagged is now rendered in light grey, italicized, and struck through (e.g. it looks like this:
293200.0), indicating that it has been flagged for exclusion. The corresponding average value (both on that row and all other constituent rows), in addition to being recalculated to reflect only the two remaining values, also gets special formatting, italics and a dotted underline, to remind you it is not based on all recorded values.
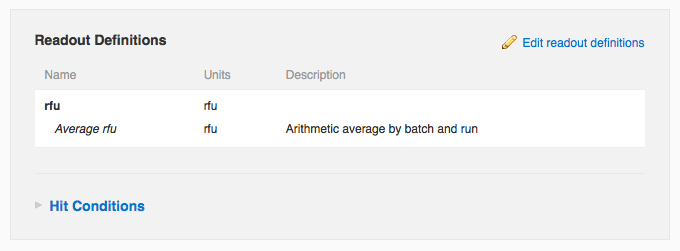
Averages
When adding or editing a readout definition, you can now specify that average values should automatically be calculated whenever you add or edit corresponding readout data. Looking at the edit readout definition form, you can see the user has specified that the “rfu” readout definition should be averaged arithmetically.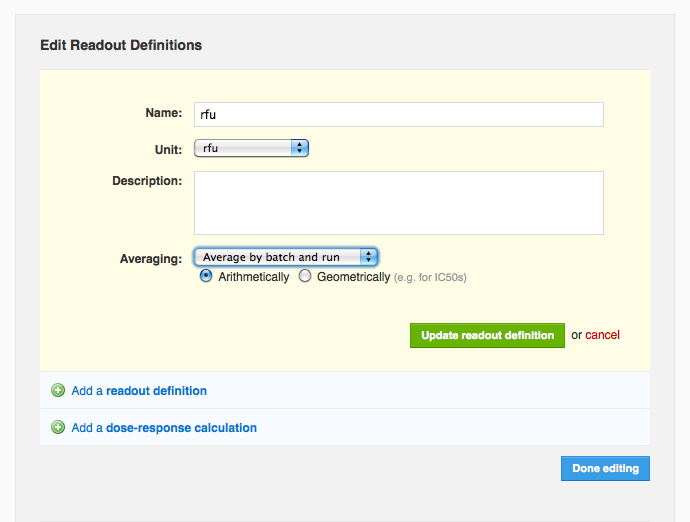 You can also see that this vault averages values by batch and run. Suppose a molecule, “caffeine”, has two batches, “starbucks” and “peets”, and that this protocol has two runs on dates March 1, 2010 and June 1, 2010. If “starbucks” had rfu values of 10000 and 20000 in the March 1 run, and “peets” had an rfu value of 6000 on March 1 and 8000 and 10000 on June 1, then the system will calculate three average values: 15000 rfu for “starbucks” on March 1, 6000 rfu for “peets” on March 1, and 9000 rfu for “peets” on June 1. It is also possible to average by molecule and protocol, in which case the system would calculate only one average value in this example, 10800 rfu for the entire protocol and the “caffeine” molecule. Currently this setting, averaging by “batch and run” (the default) or by “molecule and protocol”), is vault-level, which means it applies to all protocols in a given vault. If you'd like to change this setting, please
contact support. Once you've configured an average readout definition, you will see it listed right next to the corresponding non-averaged definition on the protocol page (below), in search results, and on the run page's data tab (next section). Note that you cannot yet configure average values for dose-response calculations.
You can also see that this vault averages values by batch and run. Suppose a molecule, “caffeine”, has two batches, “starbucks” and “peets”, and that this protocol has two runs on dates March 1, 2010 and June 1, 2010. If “starbucks” had rfu values of 10000 and 20000 in the March 1 run, and “peets” had an rfu value of 6000 on March 1 and 8000 and 10000 on June 1, then the system will calculate three average values: 15000 rfu for “starbucks” on March 1, 6000 rfu for “peets” on March 1, and 9000 rfu for “peets” on June 1. It is also possible to average by molecule and protocol, in which case the system would calculate only one average value in this example, 10800 rfu for the entire protocol and the “caffeine” molecule. Currently this setting, averaging by “batch and run” (the default) or by “molecule and protocol”), is vault-level, which means it applies to all protocols in a given vault. If you'd like to change this setting, please
contact support. Once you've configured an average readout definition, you will see it listed right next to the corresponding non-averaged definition on the protocol page (below), in search results, and on the run page's data tab (next section). Note that you cannot yet configure average values for dose-response calculations.

Outliers
Once you've configured an average, readout values that you add manually on the run page or that you import from a file via Data Import will automatically be averaged. Note that on the run page, the average value is repeated in each row involved in the average. If you modify one of the constituent values, all rows are updated. In the data below, one of the “Caffeine” measurements is wildly different from the other two. If I wish to flag that value as an outlier to exclude it from the average calculation, I can do so by editing that readout row.
 If I click on the muted flag icon next to the readout value, the flag becomes bright red, and I see text indicating that I've flagged that readout as an outlier.
 When I save my changes, I can see that the value I flagged is now rendered in light grey, italicized, and struck through (e.g. it looks like this:
293200.0), indicating that it has been flagged for exclusion. The corresponding average value (both on that row and all other constituent rows), in addition to being recalculated to reflect only the two remaining values, also gets special formatting, italics and a dotted underline, to remind you it is not based on all recorded values.
When I save my changes, I can see that the value I flagged is now rendered in light grey, italicized, and struck through (e.g. it looks like this:
293200.0), indicating that it has been flagged for exclusion. The corresponding average value (both on that row and all other constituent rows), in addition to being recalculated to reflect only the two remaining values, also gets special formatting, italics and a dotted underline, to remind you it is not based on all recorded values.
