(Originally published July 8, 2014; Updated November 21, 2019)

From the desk of Marc Navre, Ph.D.,
Co-Founder and CEO, Facile Therapeutics, Inc
A significant number of CDD Vault subscribers use IC50 values to store and analyze their dose response data from in-vitro assays. Now that the automated calculations extension of CDD Vault supports the calculation of pCI50 values, I’d like to convince users of IC50 to consider using pIC50 instead, and why it will make your life easier (in the long run), and just make you a finer human being.
I’ve worked in two small biotech companies where I was heading up both biology and informatics, and thus was able to “force” the use of pIC50 values instead of IC50 values. You would have thought I said from now on we will be eating bugs for lunch. It was a bit of an uphill battle, and there is a learning curve, but after six months, everyone was used to it, agreed it was better, and wouldn’t go back. Oh yeah, and it’s just plain “the right thing to do”.
What is IC50 in the First Place?
An IC50 measurement tells us the concentration at which a drug is able to inhibit a particular biological process by 50%. For example, if compound A can inhibit 50% of the binding of a ligand to a particular receptor at a concentration of 5 nM, it would have an IC50 value of 5 nM. A closely related concept is the EC50 value which is the potency of a drug to induce a biological process.
So then what is a pIC50? It’s simply the negative log of the IC50 value in molar. Watch:
- An IC50 of 1 µM is 10-6 M, which is pIC50 = 6.0
- An IC50 of 1 nM is 10-9 M, which is pIC50 = 9.0
- An IC50 of 10 nM is 10-8 M, which is pIC50 = 8.0
- An IC50 of 100 nM is 10-7 M, which is pIC50 = 7.0
- An IC50 of 30 nM is 3 x10⁻⁸ M, which is also 10-7.5 M, which is pIC50 = 7.5
Do you see a pattern? You’re in drug discovery… you’ve been working with pH since you were knocking over graduated cylinders in high school. When working in the lab, did you say that this solution has an acidity of 10 µM (10-5 M) [H+]? Of course not. You talked about a solution at pH 5. And you didn’t bother trying to back calculate in your head … that is, you didn’t try and convert a pH value of 7.5 to 30 nM [H+]. That’s because you’ve trained yourself to think in terms of pH, as well as the fact that the acidity of an aqueous solutions is a logarithmic function. pH values in experiments go from 1 to 2 to 3, not 10 mM to 20 mM to 30 mM [H+].
That is exactly the way you should think about IC50 values (or when testing agonists, EC50 values). Dose dependent inhibition (or activation) of an enzyme or cell is a logarithmic phenomenon (with regard to compound concentration), so it makes more sense to view the data this way. And if you look at papers from the big pharma companies, you will notice that they more often than not report inhibition as pIC50 instead of IC50.
So should you do it that way just because Merck does it that way? No, so let’s discuss why it is the right way (and why Merck, GSK, etc. use it).
The Dose Response Curve
When you crunch your dose response data, you are fitting your response (say 0-100%, to keep it simple) against the concentration of test compound (ultimately in molar). But if you look carefully at the equation for which you are running a curve fit (the Four-Parameter Logistic Function, also known as the sigmoid function), what is being calculated is response vs. the log of compound concentration.
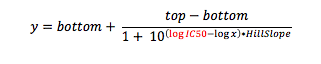
where y is the response you have measured at compound concentration x. Top is the response with no inhibitor (aka the maximum asymptote), and bottom is the response when the enzyme (or cell) is fully inhibited (aka the minimum asymptote). And of course, IC50 is the inflection point (halfway point between top and bottom), the value you are solving for.
So the curve fitting actually solves for the logIC50, not IC50. If you want to know the error from the fit, you can get a standard error (SEM) that surrounds the IC50 symmetrically. But if you start changing the pIC50 value to IC50, that error becomes asymmetric, and makes no sense.
You have to go back and do the anti-log to get the IC50. And this is easy these days with computers and Excel. So “everyone does it”. But you lose a lot in taking that “easy step”. What is the advantage? How will this change your life?
For starters, think about data presentation and significant figures (you do pay attention to significant figures, don’t you?). Think about presenting IC50 values for a range of weak to potent compounds. Your table probably looks like this:
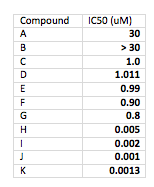
It’s hard to review the data for compounds with a wide range of potencies on the same table. With most text editors or word processors, it’s very difficult to get the numbers to line up around the decimal point (which they should do to make it most readable). You are also all over the map with significant figures. Not professional.
Now here is the same data where the table shows pIC50 values instead:
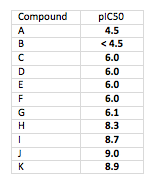
Look how clean that is. All lined up around the decimal point with no extra effort, and they all have the same number of significant figures. And most importantly, you get a better sense of the relative potencies. Which would you rather present at a project team meetings?
Now look at compounds I and J. By linear IC50s, the mindset is “twice as potent”. But look at the pIC50s. The differences aren’t that great… and that’s correct. IC50 is a log function… differences need to be thought about in terms of log differences.
Another important advantage is achieved when you try to start getting averages of your compound potencies. The proper way to average IC50 values is to take the geometric mean of the IC50 values, not the arithmetic mean. Recall that the arithmetic mean of n values is the sum of the n values divided by n. In contrast, the geometric mean can be calculated by determining the product of the n values, and then taking the n-root of the product. So if your three values are 4, 5, and 6 µM, the geometric mean is:
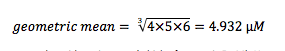
Note that it is not the same as the arithmetic mean (which of course is 5 µM). However, you can easily calculate the geometric mean of your IC50 values if you use pIC50s. This is because the geometric mean is also the arithmetic means of the logs of the IC50 values.
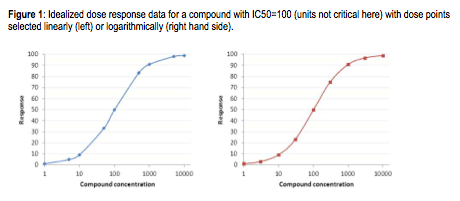
Keep this logarithmic thinking in mind when you select your compound concentrations for your dose response curves. The general tendency is to work in factors of 5: 1 nM, 5 nM, 10 nM, etc. But since you are now a pro, and working in log land, you are better off working in factors of about 3, which is roughly half a log. That is, 1 nM, 3 nM, 10 nM, etc. This gives you better spacing on your logarithmic dose response curves. See the figure below. This is a practice that translates effectively into in vivo studies: you get a better spread working at 1, 3 and 10 mg/kg rather than at 1, 5 and 10 mg/kg.
As an illustration, look at the plots below. This is a theoretical plot where data was fit to the IC50 equation with bottom = 0, top = 100, IC50= 100, and Hill slope=1. In the plot on the left, the compound concentrations were selected linearly (1, 5, 10, 50, etc). In contrast, in the plot on the left, the points were selected logarithmically (1, 3, 10, 30, etc). Note how the points on the right-hand plot are evenly spaced, while on the left-hand slide they are clumped. Since your goal in creating dose-response curves is to sample as much of “dose space” as possible, basing the doses on log intervals gives better sampling. Which shows better experimental design? Which plot gives you greater confidence in your results? Which would you rather show at a project review?