

August 14, 2015
Both CDD Vault and CDD Vision have gained major new features in this release, and we can't wait to see what you will do with them. CDD Vault is known and loved for it's collaboration capabilities— allowing distributed groups and projects to come together in a single Vault. For those collaborators using separate vaults, we are pleased to present projects between vaults, letting you explore, search, and report on data from multiple vaults simultaneously in a single view. With more data to look at, we've given you more visualizations. CDD Vision is enhanced with multiple scatter plots, all dynamically linked and filtered, letting you discover trends across multiple assays or chemical features.
 Project selection functionality remains unchanged, except now you may select several projects from different vaults. The search results include matching data from all selected data sources. This applies to all types of searches- protocols, structures, chemical properties, collections and molecule/batch keywords. Data import remains vault specific, so you still need to choose the right vault before importing a file. Here are some example uses:
 As you adjust the axes of one plot, all plots will adjust automatically to display molecules containing data for all of the selected parameters. Molecules with missing data will be removed from all plots, and the selected number of molecules will adjust automatically in the top right corner.
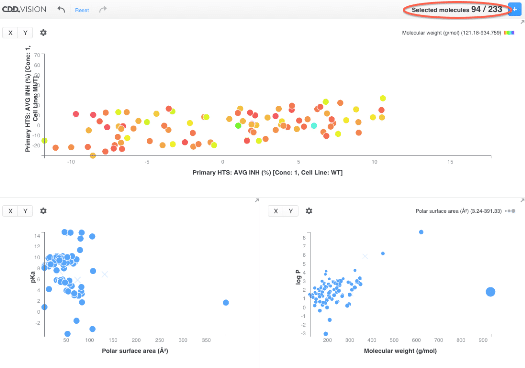
CDD Vault: More projects between vaults
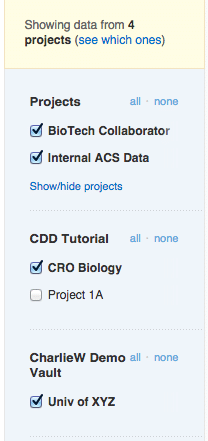
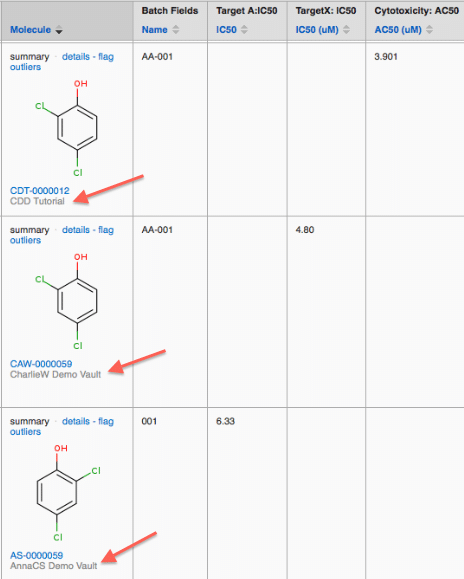
If you are a member of more than one vault, you are familiar with the process of switching between vaults to access data in each one. With this release, you can view the data in all of your vaults at once. Regardless of which vault you find yourself in, notice that the project side-bar of your Explore Data tab now contains all of your vaults and projects, selected by default. If for security reasons you need to keep your vaults separate, each individual user has the option to disable projects between vaults. Project selection functionality remains unchanged, except now you may select several projects from different vaults. The search results include matching data from all selected data sources. This applies to all types of searches- protocols, structures, chemical properties, collections and molecule/batch keywords. Data import remains vault specific, so you still need to choose the right vault before importing a file. Here are some example uses:
- Search for a mixed list of molecules by name - from your own vault and a collaborator vault
- Search for assay hits across your own assays and collaborator assays
- Do a substructure search to find all similar molecules in another vault
CDD Vision: More scatter plots
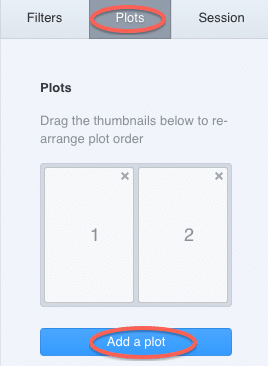
With this update to CDD Vision, you can create up to 4 different scatter plots from the same data set. All plots are based on the same set of molecules and their related chemical and biological data, so that when one plot is updated or filtered, the changes are dynamically reflected by all plots.Adding plots
Once you have loaded the search results table into Vision, go to the "Plots" tab, and click on "Add a plot". You can add up to 4 plots at a time.
- Mouse over the plot tile, and the corresponding plot will be selected.
- Click on the "x" in the top right corner of the plot tile to close the plot
- Click and drag a tile to change the positioning of plots.
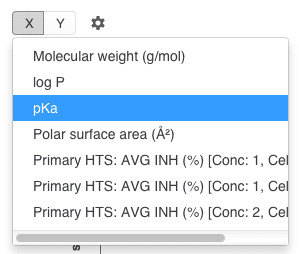
As you adjust the axes of one plot, all plots will adjust automatically to display molecules containing data for all of the selected parameters. Molecules with missing data will be removed from all plots, and the selected number of molecules will adjust automatically in the top right corner.
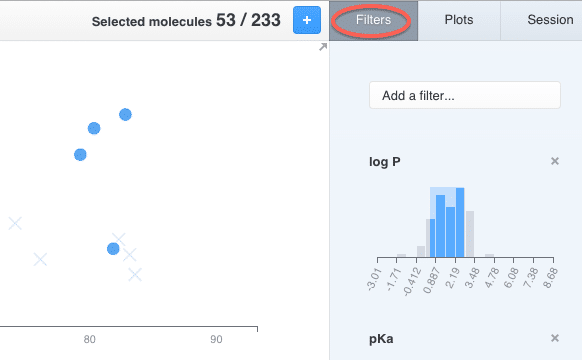
Filtering plot data
Use the histogram filters on the "Filters" tab to refine the selection. Molecules that do not meet filter criteria will be crossed out on all the plots. As before, clicking and dragging on a plot to draw a "zoom box" will filter the selection, and now that filtering will be applied to all plots.
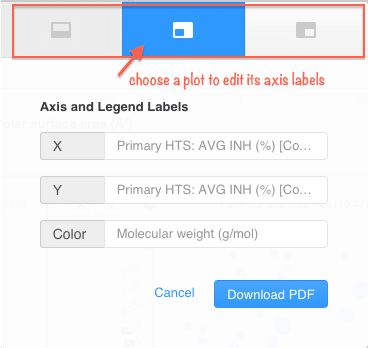
Exporting plots
You can export all the plots from the "Plots" tab. Clicking the "Export" button opens a pop-up window where you can define axis labels for each plot. Select a particular plot tile, and enter new labels, before hitting the "Download PDF" button.
And there is more!
We have added many smaller enhancements to CDD Vision including:- More intuitive design
- Highlighting of plot points when selecting a molecule from the data table
- Improved aggregation of values with modifiers to match CDD Vault