

August 20, 2010
This release completes (for now) our effort to streamline data quality control and analysis. We've enhanced data normalization and visualization capabilities, as well as tweaked the final step of the workflow for importing data. Because this release contains a lot of functionality, a short narrative will facilitate our run-through of the new features.
 She sees the Readouts section is now up top, since it's most relevant when importing protocol data. There are also four new links: to the run and to the protocol into which she imported data, and to a scatter plot and heat map of all of the data just imported. Agnes clicks the link to view the scatter plot.
  "Uh-oh", Agnes thinks, "looks like there was some drift over the course of the assay. I'm going to need to normalize this data by plate before I select a hit threshold. Also, it looks like one of the plates might be bad. Let me zoom in on that region of the plot..."
  After zooming in, Agnes can see that the plate in question is IA-215. She clicks on a point and then clicks through to the heat maps for the run to look at IA-215's heat map in context with others'.
  IA-215's heat map doesn't look bad, and certainly not different from the other plates'. She hovers her mouse over a particularly prominent hit, and sees a helpful window pop up that includes the molecular structure and the z-score (# of standard deviations from the mean). "Wow, strong hit", Agnes mutters to herself.
 "Do not normalize this readout" is currently selected, so she selects the option to normalize by plate instead. Agnes now sees a range of normalizations available to her: percent inhibition or activation, percent of positive control, percent of negative control and z score. She selects "% inhibition or activation" and trims down the default name of the normalized readout, "OD @ 520nm % inhibition or activation", to just "OD @ 520nm % inhibition":
  Agnes saves her changes, and sees that she has successfully configured the protocol to automatically normalize her raw OD readout into a percent inhibition. "Nice", she thinks to herself.
  Agnes now navigates over to the run containing the data she just imported. She notices that there's a new default tab, "Run Summary", containing a summary of the run's data and plates. She sorts the plates table by Z′-factor to see if there were any noisy plates.
  She sees that Z′-factor values between 0 and 0.5 are highlighted in yellow, to warn her that these plates might be a little noisy (values less than zero are highlighted in red). Agnes wants to make sure she's ok with these Z-factors, so she clicks to view the scatter plot again, this time of the normalized values. She uses the panel of options on the left to view just the control data, to see if they are well separated visually.
  She is gratified to see that the normalization has removed the drift and the strange effect on plate IA-215. "The controls look well separated", Agnes thinks, "let me look at the samples now to select a hit threshold". Agnes changes the options to show just samples, then overlays a line at the mean and at ±3 standard deviations of the sample data. She notes that this line lies at about 69.1% inhibition.
  Agnes navigates to the Search page and uses her visually selected hit threshold to export a list of 169 hit compounds for followup screening.
Visual Quality Control
Agnes, the protagonist of our story, has just finished running a primary screen, an enzyme inhibition assay of a small library of fifty 96-well plates. Agnes first clicks "Import Data" to import her raw primary screening data file. Her screen has a single readout, optical density (OD) at 520 nm. Once she has committed the data to her database, Agnes notices that the Summary tab on the final report looks a little different now.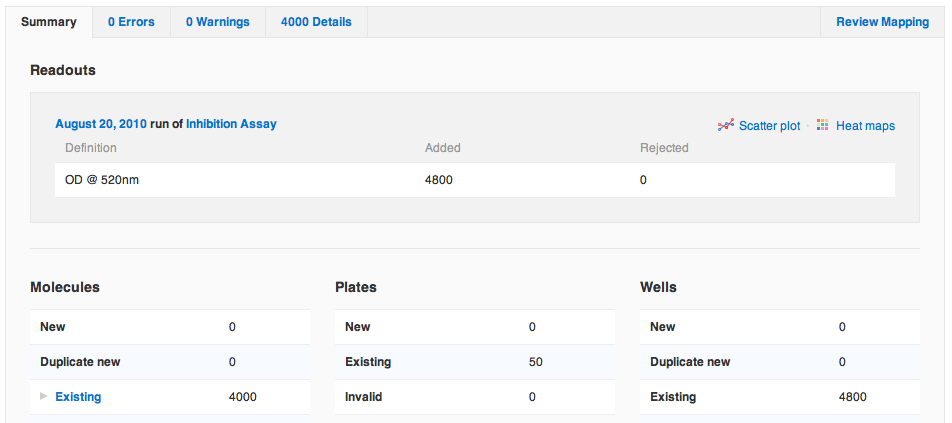 She sees the Readouts section is now up top, since it's most relevant when importing protocol data. There are also four new links: to the run and to the protocol into which she imported data, and to a scatter plot and heat map of all of the data just imported. Agnes clicks the link to view the scatter plot.
 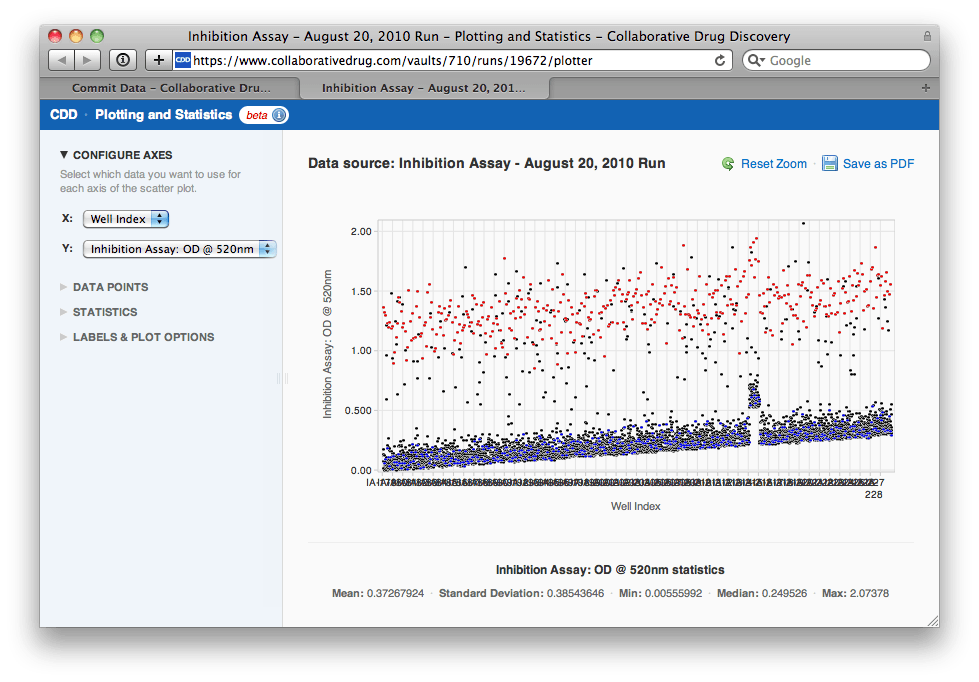 "Uh-oh", Agnes thinks, "looks like there was some drift over the course of the assay. I'm going to need to normalize this data by plate before I select a hit threshold. Also, it looks like one of the plates might be bad. Let me zoom in on that region of the plot..."
 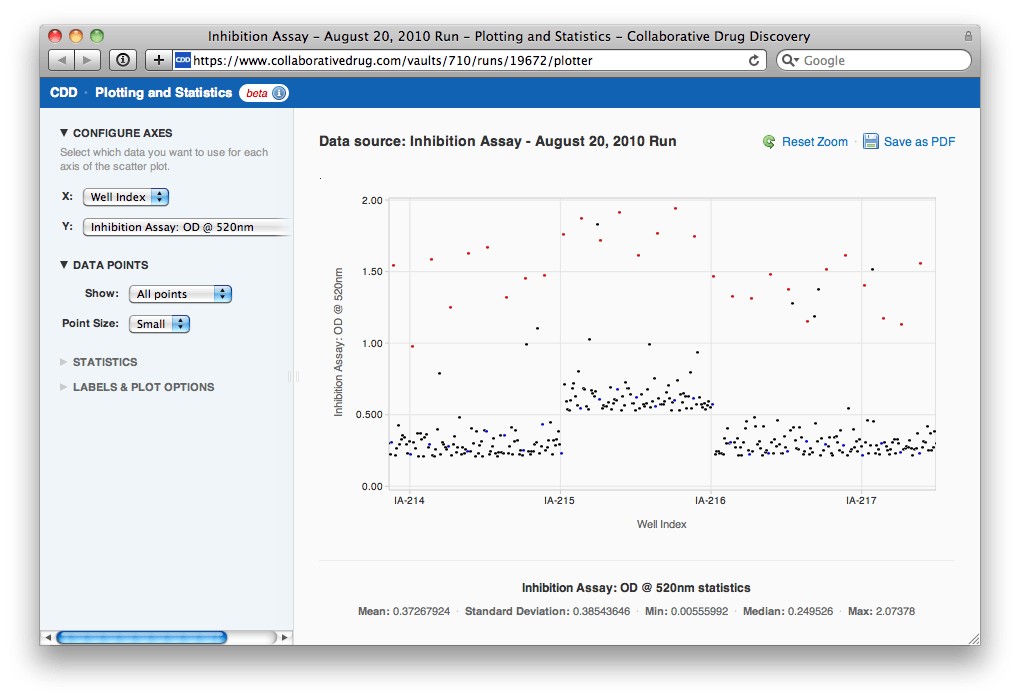 After zooming in, Agnes can see that the plate in question is IA-215. She clicks on a point and then clicks through to the heat maps for the run to look at IA-215's heat map in context with others'.
 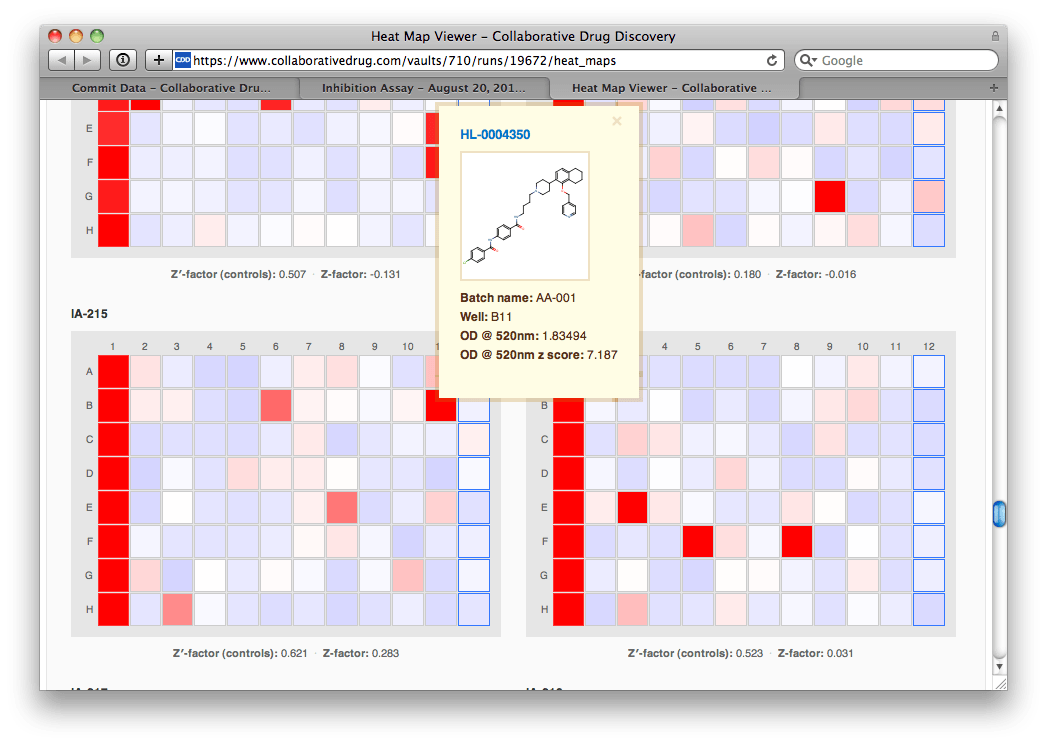 IA-215's heat map doesn't look bad, and certainly not different from the other plates'. She hovers her mouse over a particularly prominent hit, and sees a helpful window pop up that includes the molecular structure and the z-score (# of standard deviations from the mean). "Wow, strong hit", Agnes mutters to herself.
Automated Data Normalization
Agnes decides she doesn't need to exclude IA-215 from her analysis, she just needs to normalize the data by plate so that different plates' values are comparable with one another. She navigates to the protocol page and edits the raw OD readout definition. Agnes notices a new "Normalization" section near the bottom.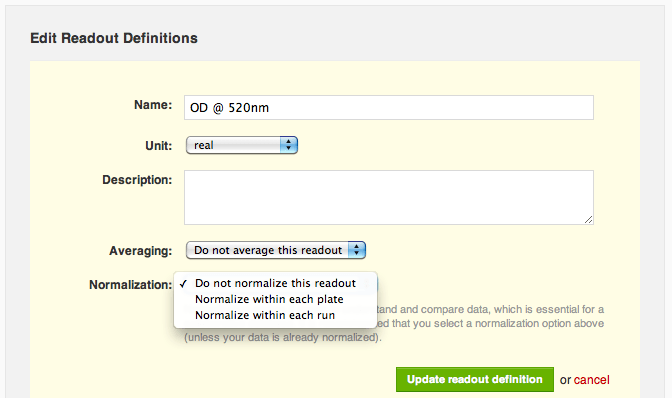 "Do not normalize this readout" is currently selected, so she selects the option to normalize by plate instead. Agnes now sees a range of normalizations available to her: percent inhibition or activation, percent of positive control, percent of negative control and z score. She selects "% inhibition or activation" and trims down the default name of the normalized readout, "OD @ 520nm % inhibition or activation", to just "OD @ 520nm % inhibition":
 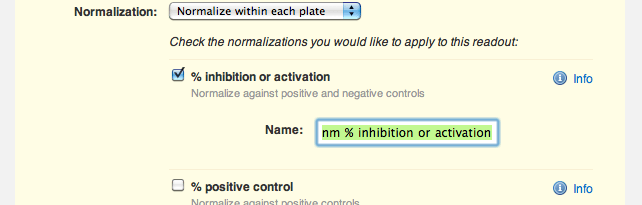 Agnes saves her changes, and sees that she has successfully configured the protocol to automatically normalize her raw OD readout into a percent inhibition. "Nice", she thinks to herself.
 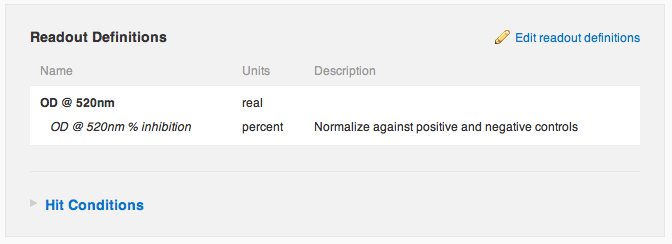 Agnes now navigates over to the run containing the data she just imported. She notices that there's a new default tab, "Run Summary", containing a summary of the run's data and plates. She sorts the plates table by Z′-factor to see if there were any noisy plates.
 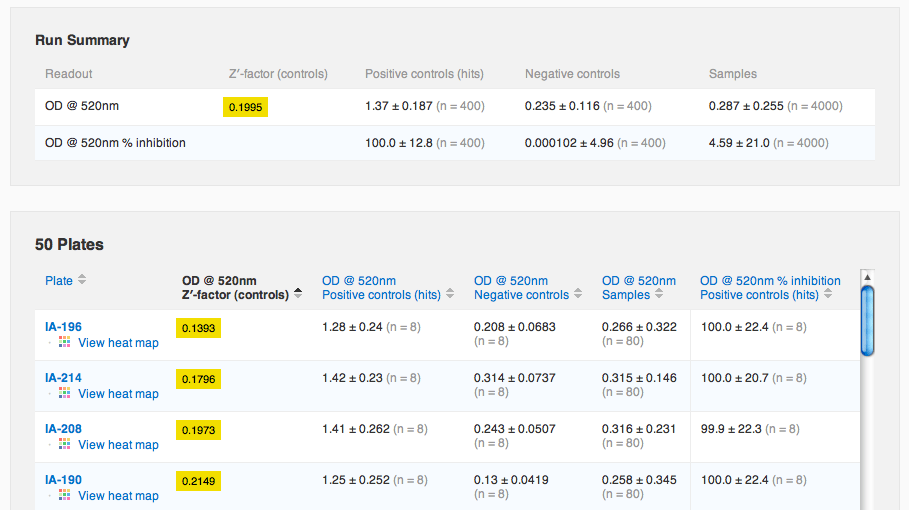 She sees that Z′-factor values between 0 and 0.5 are highlighted in yellow, to warn her that these plates might be a little noisy (values less than zero are highlighted in red). Agnes wants to make sure she's ok with these Z-factors, so she clicks to view the scatter plot again, this time of the normalized values. She uses the panel of options on the left to view just the control data, to see if they are well separated visually.
 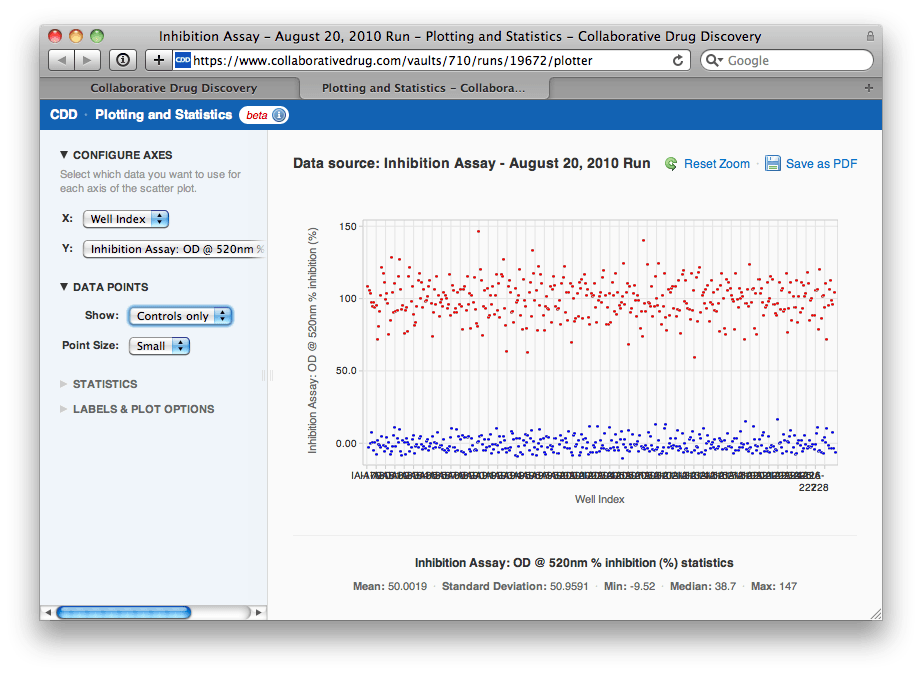 She is gratified to see that the normalization has removed the drift and the strange effect on plate IA-215. "The controls look well separated", Agnes thinks, "let me look at the samples now to select a hit threshold". Agnes changes the options to show just samples, then overlays a line at the mean and at ±3 standard deviations of the sample data. She notes that this line lies at about 69.1% inhibition.
 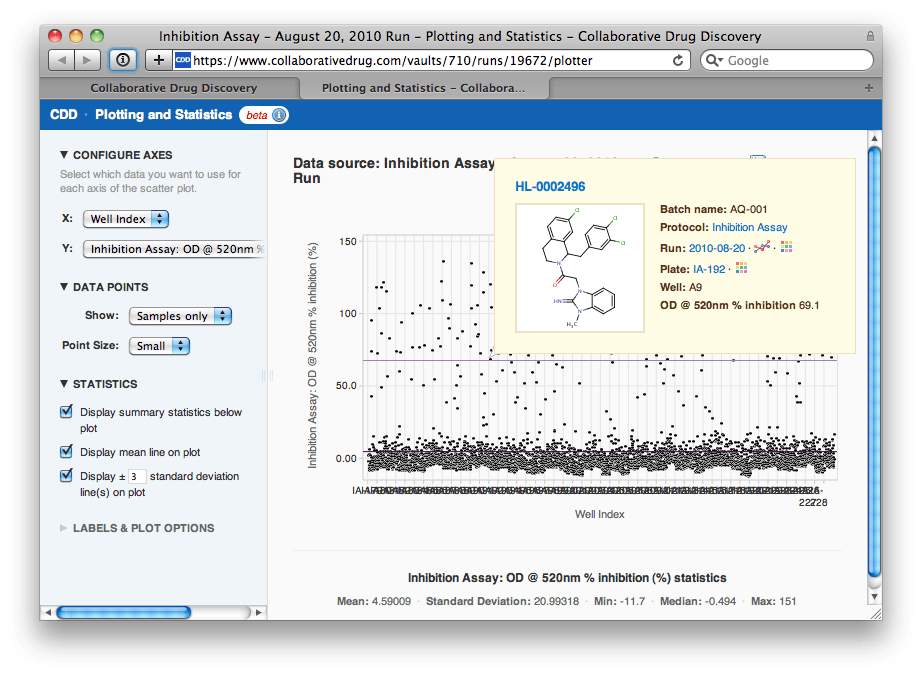 Agnes navigates to the Search page and uses her visually selected hit threshold to export a list of 169 hit compounds for followup screening.