CDD Visualization
The Elegant, Intuitive, and Free Data Visualization Tool for Scientists
Launch CDD VisualizationTired of clunky and expensive data visualization software? CDD Visualization allows you to create beautiful, publication-ready graphs and charts for free. Just select a data file, customize, and save your image!
Free to use. Submit your form and instantly access CDD's free visualization tool, designed for maximum security with no server interaction, keeping your data safe on your device.

| What's Included: | CDD Visualization (Free Version) |
CDD Visualization (Premium) |
|---|---|---|
| Import data to start visualization | ✔ | ✔ |
| Filter and color code by property and structure | ✔ | ✔ |
| Generate 3D scatter plots, bar charts, histograms | ✔ | ✔ |
| Calculate chemical properties | ✔ | ✔ |
| Save publication-quality graphs | ✔ | ✔ |
| Save visualization sessions | ✔ | |
| Share visualization with colleagues | ✔ | |
| Store data for future analysis | ✔ | |
| Manage stored data using integrated Activity & Registration and ELN functionalities | ✔ | |
| Professionally built and maintained | ✔ | ✔ |
| Fully supported and regularly updated | ✔ | ✔ |
| Data Security and Privacy | ✔ | ✔ |
| FREE - START NOW! | REQUEST FREE TRIAL |
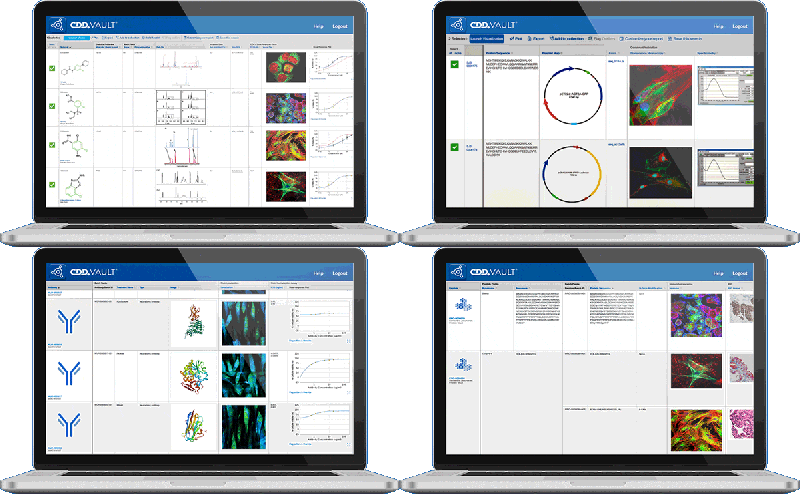
CDD Vault allows teams to access and view all their data in one place using a simple and versatile web-based portal. Highly recommend for academics and early biotechs that need to get started quickly without any prior experience with database architectures.
TIMOTHY RICHARDSON, Ph.D.
Senior Research Professor, Indiana University School of Medicine