

May 1, 2015
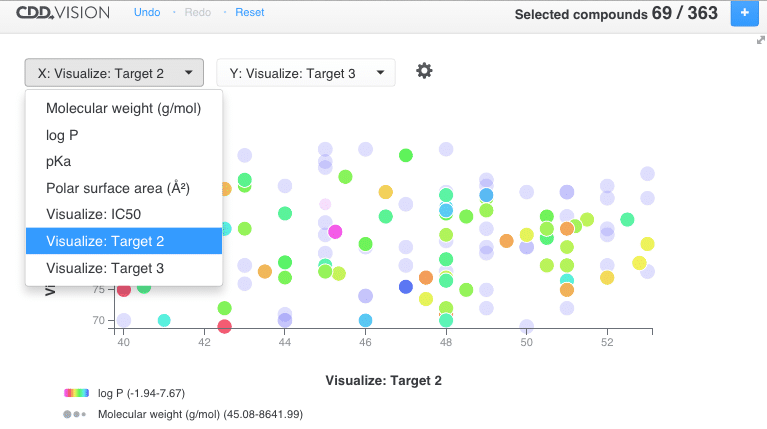
We're thrilled to announce the inaugural release of CDD Vision. Fully integrated with CDD Vault, CDD Vision provides powerful and intuitive visual analysis and plotting features. Whether you are a biologist looking for selective compounds, or a medicinal chemist looking to optimize chemical properties of active compounds, CDD Vision provides the tools to analyze and explore large data sets. Practicing the same "intuitive to use" design principles as CDD Vault, we have focused the first release of Vision on dynamic plotting of multi-parameter data-sets for visual trend inspection. New two dimensional plots may be created by choosing x and y parameters from a drop-down, while two additional parameters can be mapped to color and size.
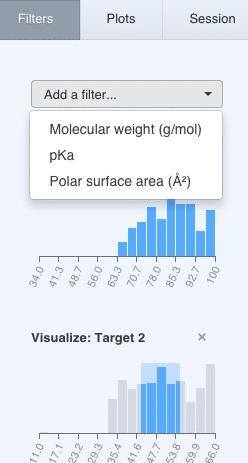
 We have also added filter controls that provide insight into data distribution using frequency histograms.
 When you are finished with your analysis, save the results as a PDF file, and send a new molecule collection back to CDD Vault.
 We believe this new offering will bring additional value to your data, and we look forward to hearing your feedback as Vision evolves over the coming year. To get started with CDD Vision and set up your first scatter plot, see
Launching a Vision Session.
We believe this new offering will bring additional value to your data, and we look forward to hearing your feedback as Vision evolves over the coming year. To get started with CDD Vision and set up your first scatter plot, see
Launching a Vision Session.
We have also added filter controls that provide insight into data distribution using frequency histograms.
When you are finished with your analysis, save the results as a PDF file, and send a new molecule collection back to CDD Vault.