

November 7, 2025
![]()
Hello, CDD users!
Here's a question - have you used the CDD Vault Visualization tool for your in-depth Structure Activity Relationship (SAR) analyses?
For over 20 years, the main Search Results Table in the Explore Data tab of CDD Vault has been the cornerstone of customers' SAR analyses. It seamlessly unifies diverse data into a clear, customizable report.
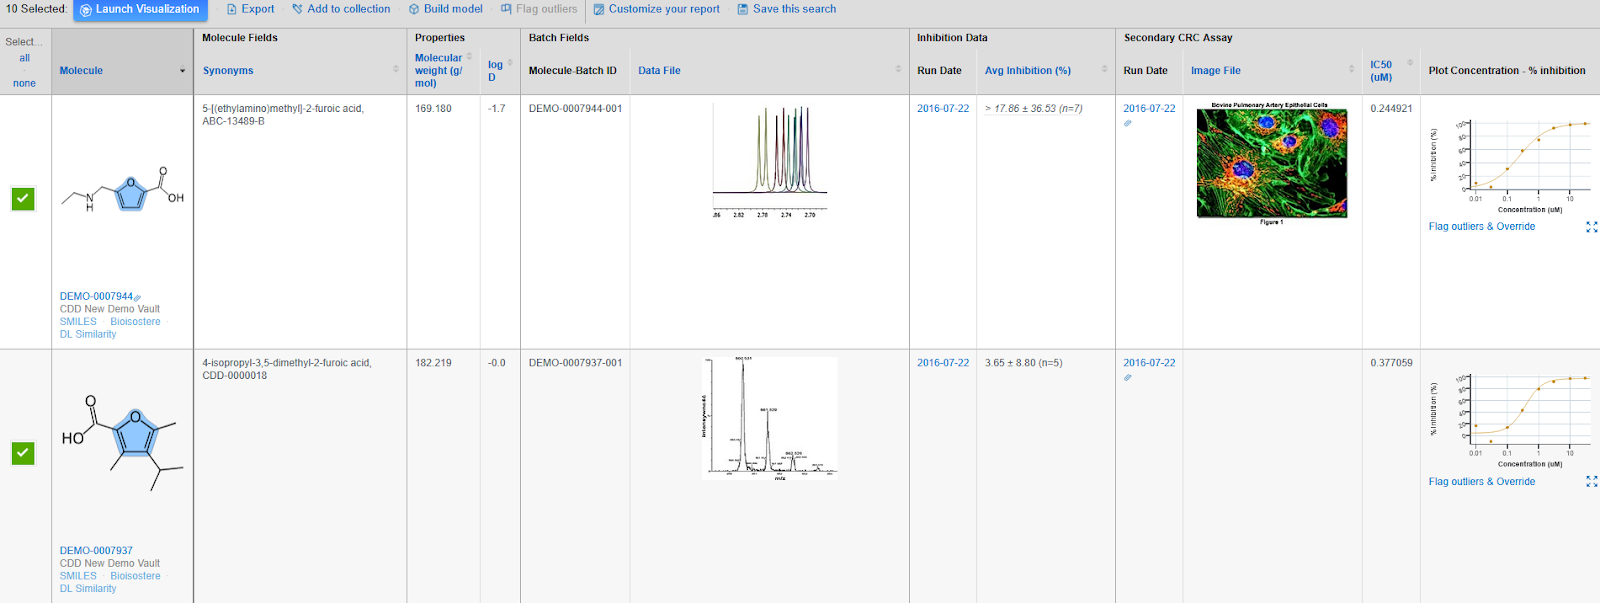
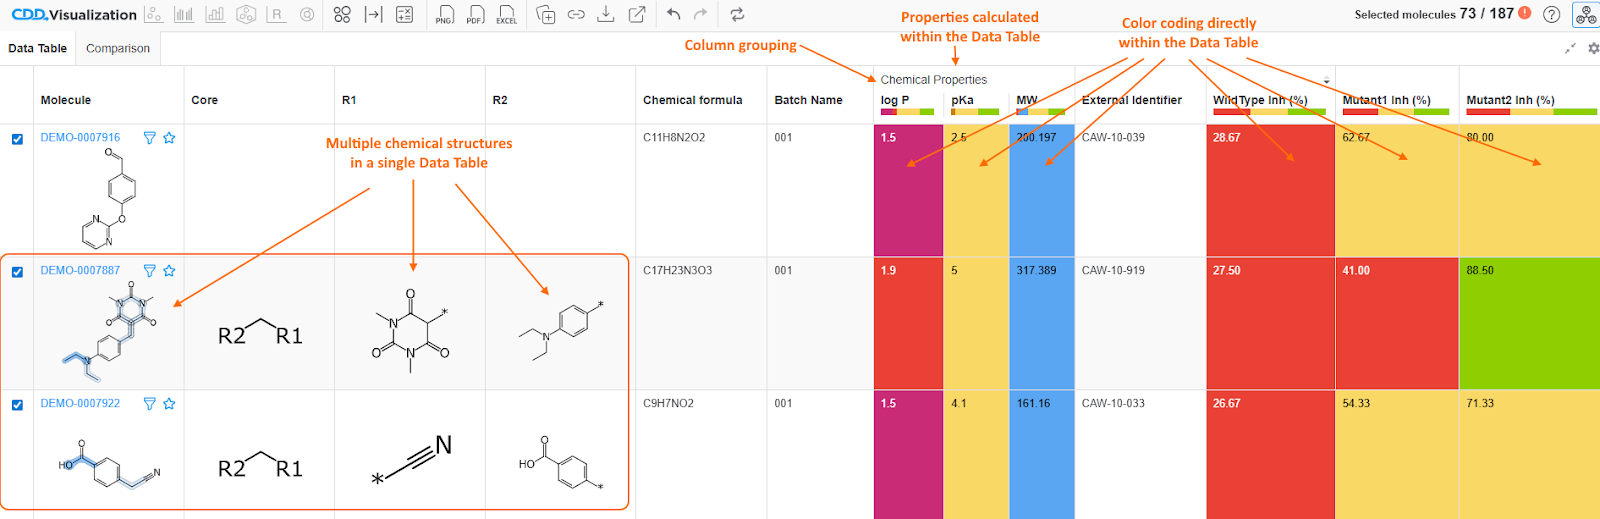
CDD Vault Visualization includes a data table much like the main Search Results Table found in the Explore Data Tab. With CDD Visualization, you’ll benefit from even further analyses and insights:
- Displaying multiple structures with explicit R-Group substructure patterns
- Adding on-the-fly calculations
- Color-coding data columns
- Adjusting column widths intuitively with your mouse
- Displaying pivoted Data Table in a single click
- Renaming column headers in the Data Table
- Organizing columns in groups
Give it a try. We think you'll like it and we welcome your ideas on how we can make it better. You can start with the feature tour when you first launch into visualization or dive right into our Knowledge base articles on Visualization to learn more.
You can also see the CDD Vault Visualization tool in action at our CDD Vault YouTube Academy.
CDD Support is always happy to schedule a working session to help you utilize these features in CDD Vault. Email CDD Support to schedule your feature review!
If this Vault Snack leaves you hungry for more, all previous Vault Snacks can be found here and always feel free to contact CDD Support — we are available to help you succeed in using CDD Vault.