Visualization
Transform complex data into clear, actionable insights with CDD Vault. Simplify interpretation, enhance collaboration, and accelerate discovery.
Visualize your Science
Data analysis and visualization doesn’t have to be complicated. Enjoy the convenience of CDD Vault’s built-in, easy-to-use suite of analytical tools.
-
Glean Insights from Data
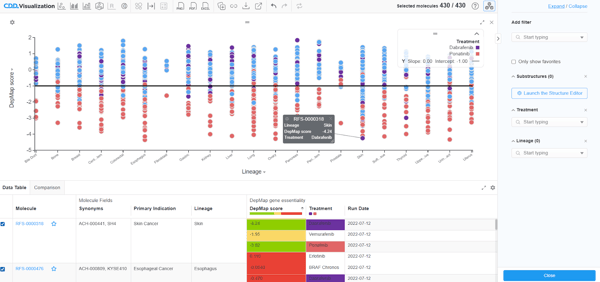
Get more out of your data by graphing, filtering, and adding calculations on the fly to optimize lead identification.

-
Simplify Data Analysis
You can access key data analysis functionalities that you need most often right here in the CDD Vault, where your data lives.

-
Generate High Quality Graphs
Export visually appealing, high-resolution graphs in various formats for publication or presentation.

-
Share Your Insights
Once you identify an interesting pattern or lead, the Data Visualization session can be saved and shared with colleagues.
.gif?width=1000&height=518&name=Save%20Viz%20Collection%20(1).gif)
Get more out of your data by graphing, filtering, and adding calculations on the fly to optimize lead identification.

You can access key data analysis functionalities that you need most often right here in the CDD Vault, where your data lives.

Export visually appealing, high-resolution graphs in various formats for publication or presentation.

Once you identify an interesting pattern or lead, the Data Visualization session can be saved and shared with colleagues.
.gif?width=1000&height=518&name=Save%20Viz%20Collection%20(1).gif)
Advanced Features of Visualization Software
Scientific data visualization tools are essential in modern drug discovery, and our drug discovery software stands out with its unique capabilities. From fostering real-time collaboration among global teams to providing in-depth analysis with customizable data visualization options, CDD Vault is designed to meet the specific needs of scientific research.
Key features include:
- Real-time collaboration tools across teams and organizations
- Comprehensive data analysis and visualization options
- Customizable dashboards tailored to specific research needs
- Secure, cloud-based data management and storage
Optimize Your Research with Scientific Data Visualization Software
Embrace the future of drug discovery with scientific data visualization software that's designed to accelerate your research. CDD Vault brings your data to life, making complex analyses more intuitive and collaborative projects more productive. Discover how our visualization tools can transform your research approach and outcomes.
Explore CDD Vault's vast capabilities and see how they can enhance your research projects. To learn more about our solutions, contact our sales team.

Key Capabilities
- Interactive graphing: Mine your data for hits, outliers and interesting relationships with interactive, dynamic histograms, scatterplots and radar plots complete with color coding and statistics.
- Filtering and sorting: Large data sets can be filtered, sorted, and clustered by properties and experimental results, helping you identify what you are looking for.
- Property calculations: Set up equations to automatically calculate derived results. Easily and routinely generate summary information, normalized activity, and compound selectivity.
- Molecule optimization score: Score your molecules for lead optimization based upon the combination of important physiochemical properties.
- Visual comparison: Compare up to four visualizations side-by-side. Look at the same data from different perspectives. Dynamically vary X/Y plotting, color and size mappings.
Navigating Your Questions: CDD Vault FAQs
Explore the possibilities of enhancing your drug discovery process with CDD Vault's scientific data visualization software. You might have questions about how it works, its features, or its integration capabilities. Below, we address some of the most frequently asked questions to help you better understand how our platform can fit into and improve your research workflow.
How Does CDD Vault Facilitate Data Visualization in Research?
CDD Vault offers a range of scientific data visualization tools that enable users to easily analyze and interpret their data, fostering better collaboration and more insightful discoveries.
What Security Measures Are in Place to Protect My Data in CDD Vault?
CDD Vault employs robust security protocols, including encryption, access controls, and regular audits, to ensure that all data is securely stored and protected against unauthorized access, maintaining the integrity and confidentiality of your research.
How can CDD Vault Help in Collaborative Projects Across Different Organizations?
With its emphasis on collaboration, CDD Vault provides tools for secure data sharing and communication across teams and organizations. These tools facilitate seamless collaboration without compromising data security, making it easier to collaborate on joint research initiatives.
CDD Vault presents data and associated tools that capture the relationship between chemical structure and biological activity. Structure-Activity Relationship (SAR) data substantially improve the distributed drug discovery process.
CHRISTOPHER LIPINSKI, Ph.D.
Pfizer, Retired, CDD Scientific Advisory Board
Propel Your Research into the Future with Visualization Software
Embrace innovation in drug discovery with CDD Vault and scientific data visualization software. Transform datasets into actionable insights, streamlining research and fostering breakthrough discoveries. Our platform offers unparalleled analysis, collaboration, and customization features for the scientific community.
Unlock the full potential of your data and accelerate your path to discovery. Explore CDD Vault today and take the first step towards revolutionizing your research process.


