

Visualization
Transform complex data into clear, actionable insights with CDD Vault. Simplify interpretation, enhance collaboration, and accelerate discovery.


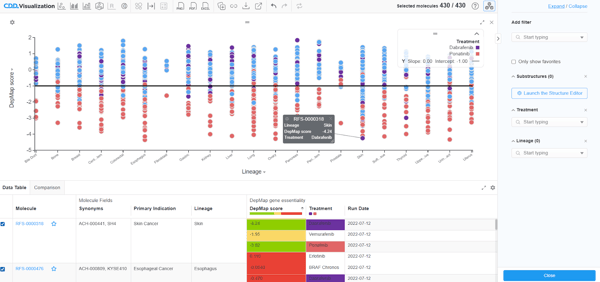
Visualize your Science
Data analysis and visualization doesn’t have to be complicated. Enjoy the convenience of CDD Vault’s built-in, easy-to-use suite of analytical tools.
-
Glean Insights from Data
Get more out of your data by graphing, filtering, and adding calculations on the fly to optimize lead identification.

-
Simplify Data Analysis
You can access key data analysis functionalities that you need most often right here in the CDD Vault, where your data lives.

-
Generate High Quality Graphs
Export visually appealing, high-resolution graphs in various formats for publication or presentation.

-
Share Your Insights
Once you identify an interesting pattern or lead, the Data Visualization session can be saved and shared with colleagues.
.gif?width=1000&height=518&name=Save%20Viz%20Collection%20(1).gif)
Get more out of your data by graphing, filtering, and adding calculations on the fly to optimize lead identification.
You can access key data analysis functionalities that you need most often right here in the CDD Vault, where your data lives.
Export visually appealing, high-resolution graphs in various formats for publication or presentation.
Once you identify an interesting pattern or lead, the Data Visualization session can be saved and shared with colleagues.
Key Capabilities
- Interactive graphing: Mine your data for hits, outliers and interesting relationships with interactive, dynamic histograms, scatterplots and radar plots complete with color coding and statistics.
- Filtering and sorting: Large data sets can be filtered, sorted, and clustered by properties and experimental results, helping you identify what you are looking for.
- Property calculations: Set up equations to automatically calculate derived results. Easily and routinely generate summary information, normalized activity, and compound selectivity.
- Molecule optimization score: Score your molecules for lead optimization based upon the combination of important physiochemical properties.
- Visual comparison: Compare up to four visualizations side-by-side. Look at the same data from different perspectives. Dynamically vary X/Y plotting, color and size mappings.
