

October 15, 2021
Max Planck, German theoretical physicist & Nobel Prize winner, wrote that an experiment is a question which science poses to Nature, and a measurement is the recording of Nature's answer. Announcing several new features in the CDD Visualization that will enhance your ability to analyze all YOUR measurements!
Molecule Overview Card Carousel Feature
To help users more easily navigate through the list of Molecules currently selected within the Visualization tool, a new Carousel feature has been added. When you click on a data point within a plot, or a Molecule Name within the data table, you can now navigate through the entire list of selected Molecules by clicking on the left and right arrow buttons.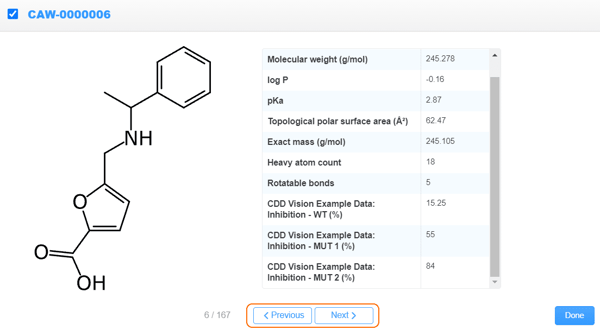
Legend Control
The legend for each plot/chart in the Visualization tool can now be collapsed to not interfere with the points and bars. Simply click on the arrow in the top-right corner of the legend to collapse, and repeat to expand.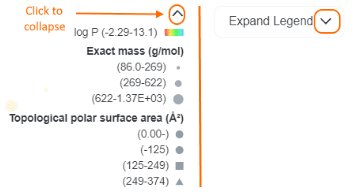
Moving Plots
When creating multiple plots/charts, you can now rearrange your plots on the page by clicking the Move icon located in the top center of each plot. Simply click, grab, and reposition your plot as desired. Delete plots by clicking the “X” in the top-right corner next to the expand icon.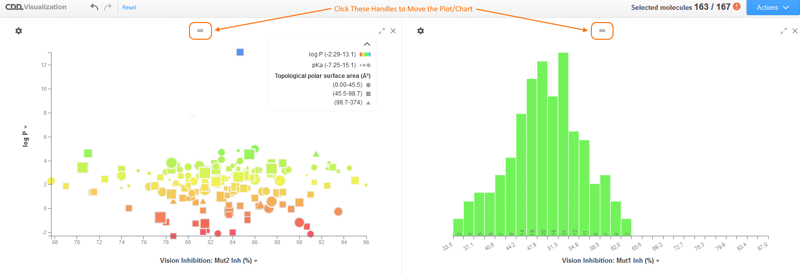
Hiding Structures
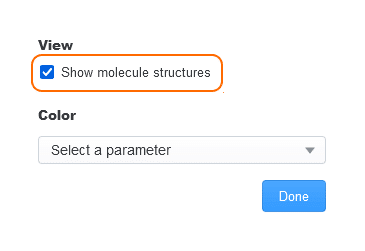
To turn off the display of chemical structures in the Visualization data table, click the “paint can” icon in the lower right corner of the data table. Then,
deselect the “Show molecule structures” check-box.
Then,
deselect the “Show molecule structures” check-box.
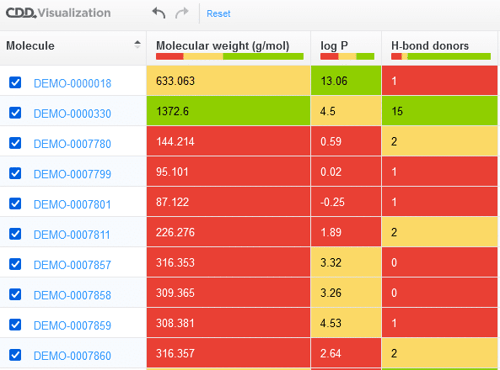
 The data table will no longer contain chemical structures in the 1st column of each row.
Bar Charts
To add a Bar Chart graph to your current Visualization session, click the Actions menu and select the “Add bar chart” menu item.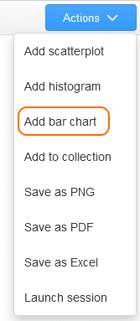 The Bar Chart will be added to your session, which you can then customize as desired.
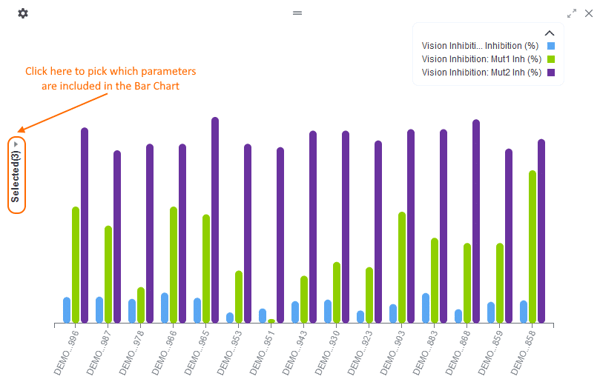 The Bar Chart can then be configured as desired.
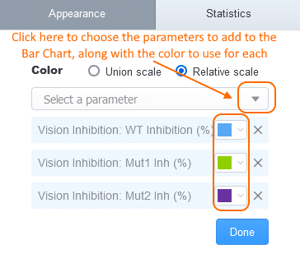 Note: The Statistics tab in the Bar Chart configuration panel can be used to display standard deviation “whiskers” on the Bar Chart.