

February 15, 2017
From the workstation of Nigel R. A. Beeley, CDD Advocate
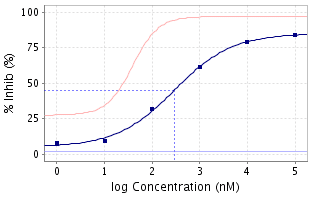
Ever since the musings of A. V. Hill (1) over 100 years ago which produced what is now known as the Hill-Langmuir equation (2) to describe pharmacological observations (the contractile effects of nicotine on the frog rectus-abdominis muscle, elaborated upon later with the O2 Hemoglobin system) as bimolecular interactions which followed the law of mass action, the dose-response curve has been a fundamental feature of both pharmacology and drug discovery and development. The curve is typically semi-logarithmic with the X-axis being the logarithm of the concentration or dose and the Y axis being response, usually measured as a percentage of some baseline value. The curve can be either ascending (agonists, enhancers) or descending (antagonists, inverse agonists) and should ideally be sigmoidal. Mixed agonist/antagonist molecules can deliver bell-shaped dose response curves. Key values such as the concentrations EC50 and IC50 can be read directly off the curve by constructing an intersecting vertical and horizontal line at the point of 50% response. Application of the Hill-Langmuir equation to such curves reveals the Hill coefficient, nH which can, in turn, lead to better understanding of the binding modes of ligands (3). More recent variants include the Gaddum equation (4) (allows for two ligands interacting with the biological system) and the Schild plot (5) (a log/log plot which can distinguish by curve shape between non-competitive, competitive and cooperative binding, heterogeneous receptors and failure to reach equilibrium).
It wasn’t too long ago that medicinal chemists working in a multidisciplinary drug discovery team would be presented with a simple number (the EC50 or IC50) by their pharmacological counterparts as an indicator of biological activity. Indeed, medicinal chemistry publications typically continue to report structure-activity relationships (SARs) in tabular forms using such numbers. The benefits of seeing the full data set behind the computed numbers, the cornerstone of today’s pharmacology/chemistry interface, were lost to parts of the team.
The advent of fully integrated database systems, such as the offerings of CDD Vault, provide multiple opportunities for examination of the details of dose response curves. Simply eyeballing the screening plate in a color coded format can provide instant feedback regarding quality, the inadvertent “sneeze” over the plate, the “drool” of the over-zealous operator, being immediately obvious. The curves themselves oftentimes can immediately raise comfort or caution, the sudden drop-off or enhancement in the curve compared to the ideal sigmoidal shape, the presence of a “straight line” even though the computer has produced a sigmoidal fit, the failure to reach an expected maximal response at high concentrations, etc. etc. all of which lead to more questions than answers that are typically followed up with repeat experiments. The modern database calculates curves on the fly which also allows for dose response curve manipulations, such as removing an obvious outlier from the curve calculation (NOT from the data set), to see how the curve changes. All in all, for 90 years the musings of A. V. Hill and his successors have been largely hidden away from parts of multidisciplinary drug discovery and development teams (6) … over the past 15 years integrated databases have changed that forever for the better.
References:
- Hill, A. V. (1910-01-22). "The possible effects of the aggregation of the molecules of hæmoglobin on its dissociation curves". Physiol. 40 (Suppl): iv–vii.
- Langmuir, Irving (June 1918). "The Adsorption of Gases on Plane Surface of Glass, Mica and Platinum". The Research Laboratory of The General Electric Company: 1361–1402
- https://en.wikipedia.org/wiki/Hill_equation_(biochemistry)
- https://en.wikipedia.org/wiki/Receptor_theory
- https://en.m.wikipedia.org/wiki/Schild_regression
- Rang HP (2006). "The receptor concept: pharmacology's big idea". J. Pharmacol. 147 (S1): S9–16.
This blog is authored by members of the CDD Vault community. CDD Vault is a hosted drug discovery informatics platform that securely manages both private and external biological and chemical data. It provides core functionality including chemical registration, structure activity relationship, chemical inventory, and electronic lab notebook capabilities.
CDD Vault: Drug Discovery Informatics your whole project team will embrace